

What Are the Best Indian Stocks to Invest in for the Long Term? Fundamental and Technical Analysis Guide
If you are planning to invest in the Indian stock market for the long term, one of the most common questions is: “Which Indian stocks are worth researching for long-term investment?”
The answer should not depend only on a company's past returns or its popularity in the market. A long-term investor should study the company's business model, revenue growth, profitability, debt, cash flow, competitive position and valuation. Technical analysis can then be used to understand price trends, momentum and potentially better entry levels.
Fundamental analysis helps you understand what you are buying, while technical analysis helps you understand how the stock is behaving in the market.
Using both approaches can provide a more structured way to research long-term investment opportunities. However, no analysis can guarantee future returns.
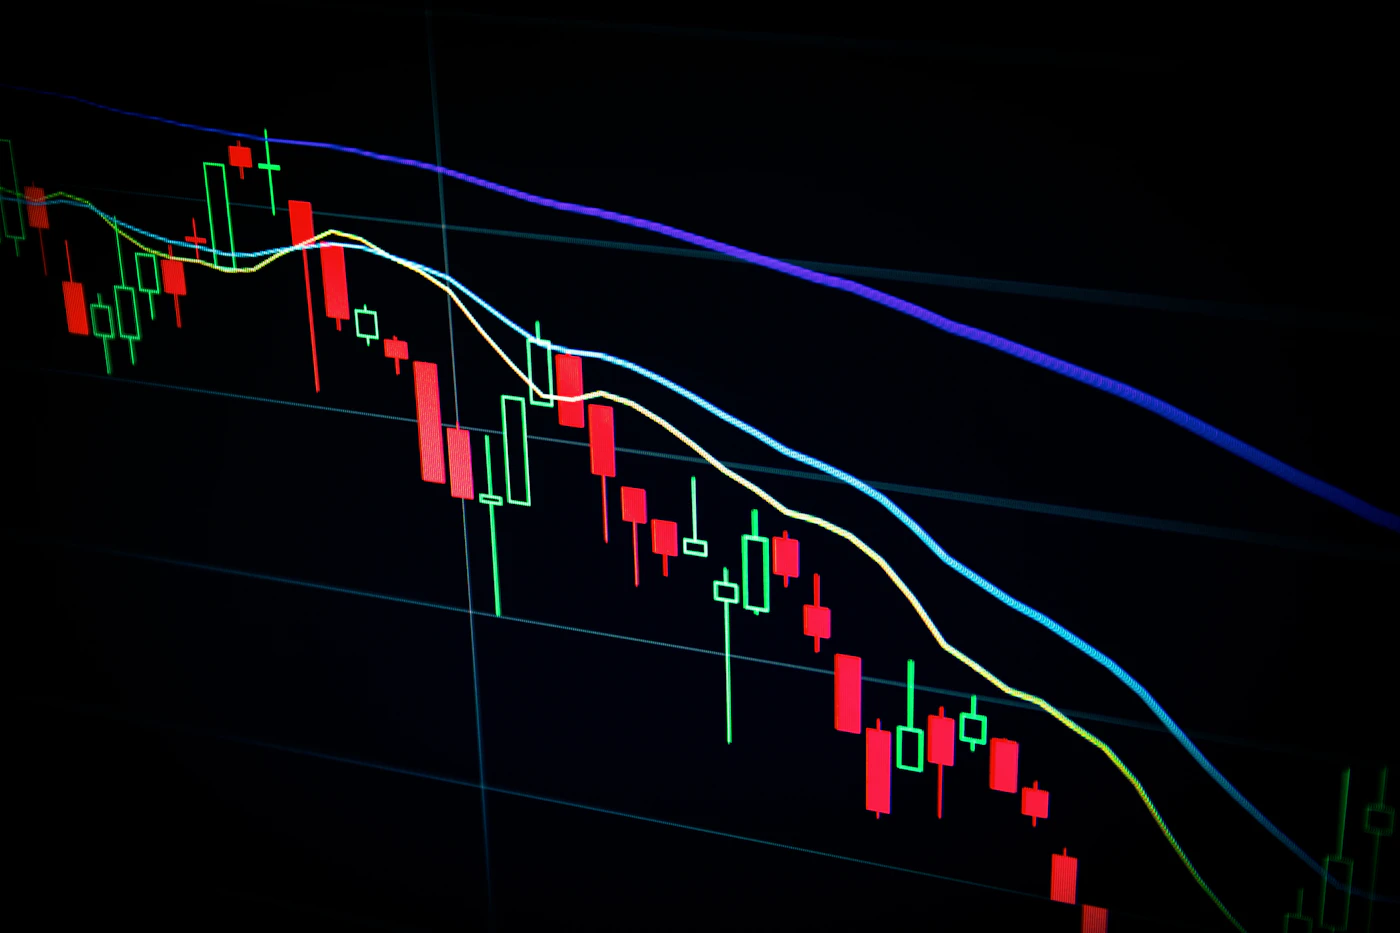
Why Should Investors Look at Large and Established Indian Companies?
The Indian equity market contains thousands of listed companies ranging from small businesses to large multinational-scale enterprises. For beginners, established companies can be easier to research because they generally have a longer operating history, publicly available financial information and greater analyst coverage.
The Nifty 50 is one useful starting point for research because it represents 50 large companies across multiple sectors. According to NSE, the index covers 13 sectors and is designed to represent diversified exposure to the Indian equity market.
However, being part of a major index does not automatically mean that a stock is attractive at every price. A good company can still become an expensive investment if its valuation rises significantly above what its earnings can justify.
What Fundamental Factors Should You Check Before Buying a Stock?
Before researching individual stocks, it is useful to create a simple fundamental-analysis checklist. The objective is to understand the quality of the underlying business.
- Revenue Growth: Is the company consistently increasing sales?
- Profit Growth: Are profits growing along with revenue?
- ROE and ROCE: Does the company generate healthy returns on shareholder and invested capital?
- Debt: Is the balance sheet manageable?
- Operating Cash Flow: Is the company actually generating cash from its operations?
- Margins: Are operating and net margins stable or improving?
- Competitive Advantage: Does the company have a strong brand, distribution network, technology or scale advantage?
- Management: Are capital allocation and corporate governance satisfactory?
- Valuation: Is the stock price reasonable compared with earnings, growth and peers?
Indian Stocks Worth Researching for Long-Term Investors
Rather than presenting a stock as a guaranteed “best stock”, investors can create a research watchlist of established businesses from different sectors. The following companies are examples of large Indian businesses that can be studied using both fundamental and technical analysis.
HDFC Bank is one of India's major private-sector banks and is widely followed by long-term investors. For fundamental analysis, investors can study its loan growth, deposit growth, net interest margin, asset quality, credit costs, capital adequacy and return ratios.
For technical analysis, investors can monitor the stock's relationship with its 20-day, 50-day and 200-day moving averages, along with RSI, MACD, volume and major support/resistance zones.
Technical data available in late September 2026 showed HDFC Bank trading below its longer-term moving averages, while its RSI was around the mid-40s. That demonstrates an important point: a fundamentally strong business does not necessarily have a bullish short-term price trend at every moment.
ICICI Bank is another major private-sector bank that can be included in a long-term research watchlist. Fundamental analysis should focus on loan growth, deposit growth, asset quality, net interest margins, return on equity and profitability.
From a technical perspective, investors can monitor the 50-day and 200-day moving averages, RSI, MACD, trading volume and previous swing highs and lows.
At the end of September 2026, available technical data showed the stock below its 20-day, 50-day and 200-day simple moving averages, with RSI in oversold territory. This does not by itself mean that the stock must rise or fall; it simply demonstrates why technical signals should be interpreted alongside fundamentals and market conditions.
Reliance Industries is one of India's most diversified large companies, with businesses spanning energy and materials, digital services, retail, media and new-energy initiatives.
Its diversification makes the fundamental analysis more interesting because investors need to evaluate different business segments rather than looking only at consolidated earnings.
For FY2025-26, Reliance reported consolidated revenue of approximately ₹11.76 lakh crore, EBITDA of approximately ₹2.08 lakh crore and profit after tax of approximately ₹95,754 crore. The company also reported strong growth in its Digital Services and Retail businesses.
For technical analysis, investors can examine long-term trend direction, 50/200-day moving averages, volume confirmation and breakout or consolidation zones.
Larsen & Toubro is a major engineering and infrastructure company with exposure to construction, technology, energy and other industrial businesses.
Long-term fundamental analysis can focus on order inflows, order book growth, execution, margins, working capital, cash generation and return ratios.
Because infrastructure companies can be sensitive to economic cycles and government/private capital expenditure, investors should also monitor the broader investment cycle.
Technically, investors can study whether the stock is maintaining a higher-high and higher-low structure and whether breakouts are supported by strong trading volume.
TCS is one of India's largest IT services companies. For fundamental analysis, investors should examine revenue growth, operating margins, deal wins, client concentration, employee utilisation, attrition, free cash flow and the company's ability to adapt to changing technology trends.
The IT sector is also influenced by global technology spending, currency movements and demand from major markets such as the United States and Europe.
From a technical perspective, investors can monitor long-term moving averages, trend structure, relative strength, volume and previous support/resistance levels.
Bharti Airtel can be researched as a long-term telecom and digital-services business. Important fundamental metrics include average revenue per user, subscriber growth, 4G/5G adoption, EBITDA margins, spectrum-related obligations, capital expenditure and free cash flow.
Telecom is a capital-intensive industry, so investors should pay close attention to debt, cash generation and return on invested capital.
For technical analysis, investors can study trend direction, moving-average support, volume and momentum indicators before considering an entry.
Sun Pharma is one of India's major pharmaceutical companies. Fundamental analysis can include domestic formulations, specialty products, international business, research and development, regulatory developments, margins and cash generation.
Pharmaceutical stocks also carry company-specific risks related to regulatory approvals, product launches, pricing and competition. Therefore, investors should avoid analysing a pharma company using only its historical profit growth.
Technical analysis can be used to identify broader trends, consolidation zones, support and resistance and momentum changes.
ITC is another established Indian company that investors may research for long-term portfolios. Its businesses include FMCG and other segments, and its financial profile can be studied through revenue growth, margins, cash flows, dividend history and capital allocation.
For long-term investors, the important question is not simply whether a company pays dividends. The bigger question is whether the business can continue generating sustainable cash flows and allocate capital efficiently over many years.
Long-Term Stock Research Watchlist
| Company | Sector | Fundamental Factors to Study | Technical Factors to Monitor |
|---|---|---|---|
| HDFC Bank | Banking | Loan growth, deposits, NIM, asset quality, ROE | 50/200 DMA, RSI, volume, support |
| ICICI Bank | Banking | Credit growth, NIM, asset quality, ROE | Trend, DMA, RSI, MACD |
| Reliance Industries | Diversified | Retail, Digital, O2C, cash flow, debt | Long-term trend, volume, breakout zones |
| L&T | Infrastructure | Order book, execution, margins, cash flow | Trend structure, DMA, volume |
| TCS | IT Services | Revenue, margins, deal wins, FCF | DMA, RSI, support/resistance |
| Bharti Airtel | Telecom | ARPU, subscribers, capex, debt, FCF | Trend, momentum, volume |
| Sun Pharma | Pharma | Margins, specialty portfolio, R&D, cash flow | Trend, RSI, support/resistance |
| ITC | FMCG | Cash flow, margins, dividend, capital allocation | DMA, trend, support/resistance |
How to Use Technical Analysis for Long-Term Investing
Technical analysis does not need to become complicated for a long-term investor. Instead of using dozens of indicators, investors can focus on a few useful tools.
1. 50-Day Moving Average
The 50-day moving average can help identify the medium-term price trend. When the stock consistently trades above the 50-day moving average, it may indicate stronger medium-term momentum. However, this should not be treated as a standalone buy signal.
2. 200-Day Moving Average
The 200-day moving average is commonly used to study the long-term trend. A stock trading above a rising 200-day moving average may indicate a stronger long-term price structure, while a sustained breakdown below it may require additional investigation.
3. RSI
The Relative Strength Index, or RSI, is a momentum indicator. Investors commonly use the 30 and 70 levels as reference points for oversold and overbought conditions. But an oversold stock can remain weak, and an overbought stock can remain strong. Therefore, RSI should be combined with price action and fundamentals.
4. Volume
Volume can provide useful confirmation. For example, a price breakout accompanied by substantially higher volume can be more meaningful than a breakout occurring on very low volume.
5. Support and Resistance
Previous swing highs and lows can help investors identify important price zones. Rather than trying to predict the exact bottom, long-term investors can use these zones to plan purchases gradually.
Why Combine Fundamental and Technical Analysis?
Fundamental and technical analysis answer different questions.
| Fundamental Analysis | Technical Analysis |
|---|---|
| What does the company do? | What is the current price trend? |
| Is revenue growing? | Is momentum improving or weakening? |
| Are profits sustainable? | Where are important support zones? |
| Is debt manageable? | Is the stock above or below major moving averages? |
| Is the valuation reasonable? | Is volume confirming the price move? |
First identify financially strong businesses using fundamental analysis. Then use technical analysis to study the trend and potentially plan staggered entries rather than investing the entire amount at one price.
Do Not Ignore Valuation
One of the biggest mistakes investors make is confusing a great company with a great investment at every price.
For example, a company may have strong revenue growth, excellent management and a powerful competitive position. But if the stock price already reflects extremely optimistic future growth, the potential return from that price can be different from the quality of the business.
Therefore, investors should compare valuation metrics such as:
- Price-to-Earnings (P/E)
- Price-to-Book (P/B)
- EV/EBITDA
- PEG ratio where appropriate
- Free cash flow yield
- Dividend yield
- Historical valuation range
- Valuation compared with industry peers
Should You Invest in Only One Stock?
Long-term investing does not mean putting all your money into one company. Even excellent businesses can experience temporary or permanent problems.
A diversified portfolio can spread exposure across sectors such as banking, technology, consumer businesses, healthcare, infrastructure and telecom. The appropriate level of diversification depends on an investor's goals, time horizon and risk tolerance.
Investors should also remember that stock prices can fall significantly even when the underlying company remains fundamentally strong. Market cycles, interest rates, economic conditions, geopolitical events and investor sentiment can all influence prices.
Common Mistakes to Avoid When Selecting Long-Term Stocks
- Buying only because the stock is popular: Popularity is not the same as valuation.
- Chasing past returns: A stock that performed well in the past may not repeat the same performance.
- Ignoring debt: Rising debt can increase financial risk.
- Ignoring valuation: A good business can still be overpriced.
- Using only technical indicators: Charts cannot replace business analysis for a long-term investment thesis.
- Using only fundamentals: Entry price and market trend can also affect the investment experience.
- Investing everything at once: Staggered investing may help manage entry-price risk.
- Not reviewing the investment thesis: Long-term does not mean “buy and forget”.
Long-Term Stock Selection Checklist
Before buying any individual stock, ask:
- Do I understand the company's business?
- Is revenue growing consistently?
- Are profits and cash flows healthy?
- Is debt under control?
- Does the company have a sustainable competitive advantage?
- Are management and corporate governance acceptable?
- Is the current valuation reasonable?
- What are the major business risks?
- What does the 50-day trend show?
- What does the 200-day trend show?
- What are the important support and resistance zones?
- Am I investing according to my financial goal and risk tolerance?
Conclusion: How Should You Approach Long-Term Stock Investing?
There is no single stock that is guaranteed to be the best investment for every investor. The more useful approach is to build a watchlist of financially strong businesses and evaluate them at reasonable valuations.
Companies such as HDFC Bank, ICICI Bank, Reliance Industries, Larsen & Toubro, TCS, Bharti Airtel, Sun Pharma and ITC can be studied as examples of established businesses across different sectors. However, the fact that a company appears on a research watchlist should not be interpreted as a personal recommendation to buy it.
Fundamental analysis can help you understand the business, while technical analysis can help you study price trends and potential entry zones. Combining both with diversification, valuation discipline and a long-term investment plan can create a more structured research process.
Stock market investing involves risk. Share prices can rise or fall, and past performance does not guarantee future returns. Always conduct your own research and consider consulting a SEBI-registered investment adviser if you need personalised investment advice.
Want to Learn More About Stock Market Investing?
Learn the basics of fundamental analysis, technical analysis, risk management and long-term investing before making investment decisions.
Explore ALFINZ
Shiva Kumar is the Founder of ALFINZ, a financial planning and investment advisory platform dedicated to helping individuals make informed financial decisions. He holds NISM certifications in Equity Derivatives, Currency Derivatives, Equity Research Analysis, and Mutual Fund RTA. Through ALFINZ, he shares practical insights on financial planning, stock market investing, mutual funds, insurance, taxation, and wealth creation.