
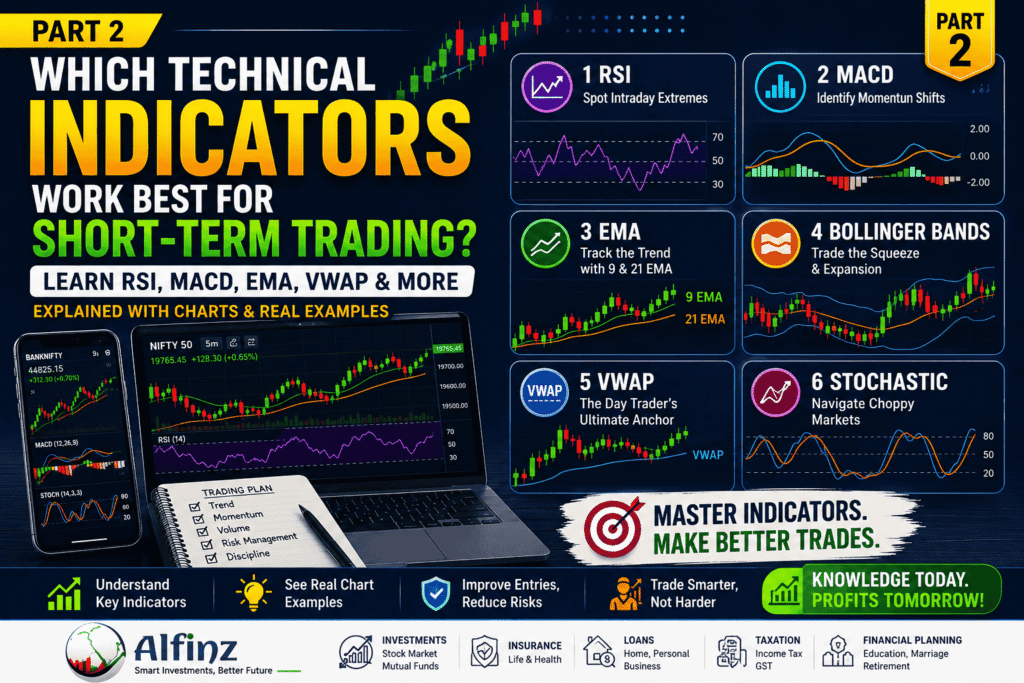
Learn Individual Technical Indicators: Learn RSI, MACD, EMA, VWAP & More
Before going through the article please refer part 1 for basic understanding about Technical indicators
What are the Best Technical Indicators for Short-Term Trading? Part-1
Overview & Basics
Choosing the best technical indicators for short-term trading is not about finding the most popular tool. It is about understanding what each indicator measures and when it performs best.
At Alfinz, we have observed that beginners often keep changing indicators after every losing trade. In reality, consistent traders master a few reliable indicators instead of constantly searching for new ones.
Let us understand the most trusted indicators used by professional intraday traders and scalpers.
1.Relative Strength Index (RSI): Spotting Intraday Extremes
What is RSI?
The Relative Strength Index (RSI) is one of the popular & most commonly used momentum indicators in technical analysis.
“It measures the speed and strength of recent price movements on a scale from 0 to 100”
RSI helps traders identify whether buyers or sellers are currently dominating the market. Unlike moving averages, RSI focuses on momentum rather than trend direction.
Why Do Short-Term Traders Prefer RSI?
Intraday traders need to know whether momentum is increasing or fading.
RSI provides this information quickly.
When momentum starts weakening, traders can prepare for possible reversals or profit booking.
However, RSI should never be used alone.
Strong trends can keep RSI in overbought or oversold zones for a long time.
Standard RSI Settings & How it works
For most beginners, these settings work well:
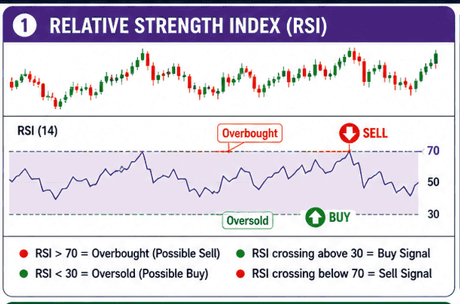
- Period: 14
- Overbought Level: 70
- Oversold Level: 30
Aggressive scalpers sometimes use:
- RSI Period: 7 or 9
- Overbought & Oversold levels as 80 & 20
These settings generate faster signals but also increase false signals.
Generally,
- RSI above 70 indicates strong buying momentum.
- RSI below 30 indicates strong selling pressure.
Many beginners immediately sell above 70 and buy below 30. This is a common mistake.
Professional traders wait for RSI confirmation instead of reacting instantly.
Practical Indian Example
Suppose Infosys opens strongly after announcing better-than-expected quarterly results.
Within thirty minutes, RSI moves above 75.
A beginner immediately sells because RSI looks overbought.
However, the stock continues rising throughout the day.
Why?
Because strong trends can remain overbought for several hours.
Instead of selling immediately, experienced traders wait for RSI to turn downward along with price weakness before considering a short trade.
Advantages of RSI
- Easy to understand
- Suitable for beginners
- Excellent for identifying momentum
- Works well with support and resistance
- Useful in ranging markets
Limitations of RSI
- Gives false signals during strong trends
- Not suitable as a standalone indicator
- Can lock at extremes levels during strong trends.
Pro Tip from Our Experience
Instead of asking,
“Is RSI above 70?”
Ask,
“Is RSI above 70 while price is also reaching resistance and volume is slowing?”
This small change improves trading decisions significantly.
2.Moving Average Convergence Divergence (MACD): Identifying Momentum Shifts
What is MACD?
The MACD is both a momentum and trend-following indicator.
It compares two exponential moving averages to identify changes in market momentum.
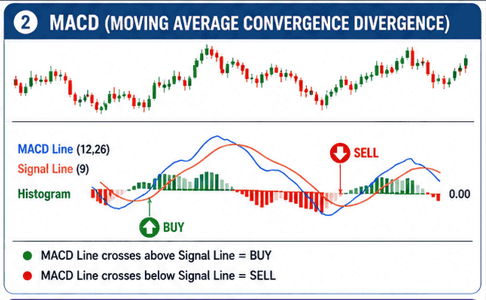
MACD consists of:
- MACD Line
- Signal Line
- Histogram
Together, they help traders identify possible trend changes before they become obvious.
Default MACD Settings
Most traders use:
- Fast EMA: 12
- Slow EMA: 26
- Signal EMA: 9
Mostly these settings work better across most intraday charts.
How MACD Generates Signals
A bullish signal occurs when:
- MACD crosses above the Signal Line.
A bearish signal occurs when:
- MACD crosses below the Signal Line.
The histogram also provides useful clues.
Increasing histogram bars indicate strengthening momentum. Shrinking bars indicate weakening momentum.
Indian Market Example
Suppose Reliance Industries trades sideways during the first hour.
Suddenly,
- MACD crosses upward.
- Volume increases.
- Price breaks morning resistance.
These combinations will give us clear confirmation than MACD alone.
Advantages
- Excellent trend confirmation
- Identifies momentum shifts
- Easy visual interpretation
- Suitable for beginners
Limitations
- Slightly delayed signals
- Less effective during sideways markets
- Needs volume confirmation
Practical Tip
MACD crossovers become far more reliable when they occur above VWAP or above the 21 EMA.
3.Exponential Moving Averages (EMA): The Power of the 9 and 21 Periods
What is EMA?
The Exponential Moving Average (EMA) gives tells more about recent prices changes.
Because of this, EMA reacts faster than a Simple Moving Average (SMA).
This makes it ideal for short-term trading.
Why 9 EMA and 21 EMA?
Professional intraday traders commonly use:
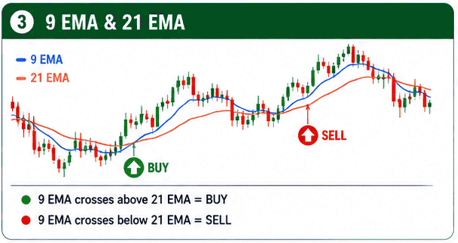
- 9 EMA
- 21 EMA
The 9 EMA represents short-term momentum.
The 21 EMA reflects the immediate trend.
Their relationship helps traders identify entry opportunities.
Bullish Setup
When:
- 9 EMA crosses above 21 EMA
- Price remains above both averages
- Volume supports the move
The probability of continuation increases.
Bearish Setup
When:
- 9 EMA falls below 21 EMA
- Price stays below both averages
- Selling volume increases
The market often remains weak.
Real-Life Example
Imagine Nifty 50 opens flat.
After thirty minutes,
- Price crosses above both EMAs.
- Volume expands.
- MACD turns positive.
Many professional traders look for buying opportunities only after this confirmation.
Advantages
- Excellent trend identification
- Easy to understand
- Works well with price action
- Reduces emotional decisions
Limitations
- Delayed during sudden reversals
- Lack of perfect crossover in sideways markets
Professional Advice
Never trade solely because of an EMA crossover.
Always confirm with volume or momentum.
4.Bollinger Bands: Trading the Squeeze and the Expansion
What are Bollinger Bands?
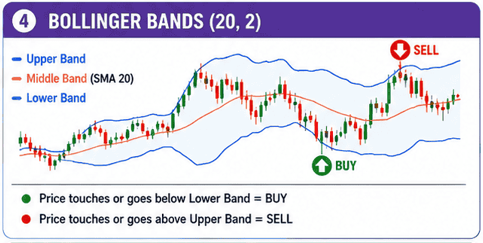
Bollinger Bands measure market volatility.
They consist of:
- Upper Band
- Middle Moving Average
- Lower Band
When volatility decreases, the bands contract.
When volatility increases, the bands expand.
The Bollinger Band “Squeeze”
One of the most powerful concepts is the Bollinger Band Squeeze.
Narrow bands indicate low volatility.
Note: Low volatility often comes before a strong breakout.
Professional traders patiently wait for expansion after contraction.
“Expansion” Phase
When price breaks even outside the bands with stronger volume,
Momentum often accelerates. This creates high-probability trading opportunities.
Indian Scenario
Suppose TCS trades within a narrow range before the RBI policy announcement.
Bollinger Bands become extremely tight.
After the announcement,
Price breaks above the upper band with heavy volume. This signals expanding volatility.
Advantages
- Excellent volatility measurement
- Useful breakout identification
- Helps estimate profit potential
Limitations
- Bands do not indicate direction
- False breakouts are common
- Needs volume confirmation
Practical Tip
Avoid entering trades before breakout confirmation.
Wait for candle closing and volume support.
5.Volume Weighted Average Price (VWAP): The Day Trader’s Ultimate Anchor
What is VWAP?
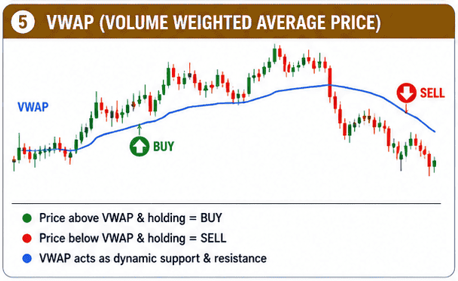
VWAP (Volume Weighted Average Price) calculates the average traded price while considering volume.
Unlike normal moving averages,
VWAP resets every trading day.
This makes it one of the most respected indicators among professional intraday traders.
Why is VWAP Important?
Large institutional investors often monitor VWAP.
Because of this,
Price reactions around VWAP become meaningful.
Basic Interpretation
Above VWAP says Buying strength.
Below VWAP says Selling pressure.
Near VWAP says Balanced market.
Example:
Suppose ICICI Bank opens strongly.
Price remains above VWAP throughout the morning.
Every pullback respects VWAP.
Professional traders often buy near VWAP rather than chasing high prices.
Advantages
- Institutional benchmark
- Excellent trend confirmation
- Useful support and resistance
- Highly respected by intraday traders
Limitations
- Useful only during the trading day
- Less effective for swing trading
Experience-Based Tip
If price, EMA, and VWAP all point in the same direction,
Trade quality improves significantly.
6.Stochastic Oscillator: Navigating Choppy, Range-Bound Markets
What is the Stochastic Oscillator?
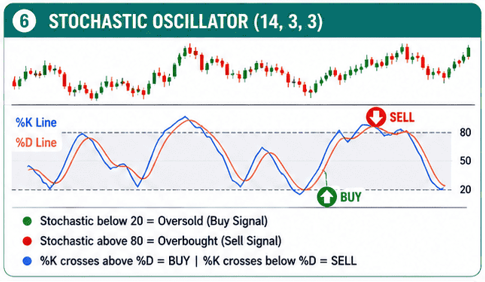
The Stochastic Oscillator measures where the current closing price lies relative to the recent trading range.
Like RSI, It moves between 0 and 100.
Standard Settings
Most traders use:
- 14,3,3
These settings work well for beginners.
Reading the Indicator
Above 80: Potentially overbought.
Below 20: Potentially oversold.
Again,These are warning zones—not automatic buy or sell signals.
Where Does It Work Best?
Unlike RSI,
The Stochastic Oscillator performs exceptionally well during sideways markets.
It struggles during powerful trends.
Practical Example
Imagine HDFC Bank trades between ₹1,950 and ₹1,975 for several hours.
Stochastic repeatedly moves between 20 and 80.
Range traders buy near support and sell near resistance using stochastic confirmation.
Advantages
- Excellent for range-bound trading
- Fast momentum identification
- Easy to interpret
Limitations
- Too many signals during trending markets
- Needs price action confirmation
Professional Suggestion
Use Stochastic only after confirming that the market is not trending strongly.
Importance of Choosing the Right Indicator
Many traders ask, “Is there any single best technical indicator for short-term trading?”
The honest answer is: There isn’t one.
Every indicator solves a different problem.
- RSI measures momentum.
- EMA identifies trend.
- VWAP tracks institutional pricing.
- MACD confirms momentum shifts.
- Bollinger Bands measure volatility.
- Stochastic works in ranging markets.
The real edge comes from understanding when to use each indicator rather than expecting one indicator to do everything.
Also read our next article
What are the Best Technical Indicators for Short-Term Trading? Part-3
Strategy & Execution
Alfinz – Based Advice
During our interactions with retail investors, we often notice a common pattern. Many traders focus heavily on finding a “perfect” indicator while spending very little time learning market structure or managing risk.
Instead of switching indicators after every loss, we recommend selecting two or three complementary indicators, practicing them consistently on historical charts, and maintaining a detailed trading journal.
This disciplined approach helps build confidence and improves decision-making over time. “Remember, successful trading is built on consistency—not on constantly changing strategies.”
Contact Alfinz Today for Personalized Investment Guidance Before You Start Investing
Need personalized financial guidance?
Contact Alfinz today for Investments, Insurance, Loans, Taxation & Financial Planning assistance.
Disclaimer: This article is published for general educational and informational purposes only. The content shared is based on common financial planning principles and personal finance awareness. It should not be considered professional financial, investment, tax, legal, or insurance advice. Financial decisions should always be made based on individual goals, risk profile, income, and personal circumstances. Readers are advised to consult a qualified financial advisor or professional before making any financial or investment decisions. Alfinz shall not be responsible for any financial loss or decisions taken based on this content.

Shiva Kumar is the Founder of ALFINZ, a financial planning and investment advisory platform dedicated to helping individuals make informed financial decisions. He holds NISM certifications in Equity Derivatives, Currency Derivatives, Equity Research Analysis, and Mutual Fund RTA. Through ALFINZ, he shares practical insights on financial planning, stock market investing, mutual funds, insurance, taxation, and wealth creation.