
Overview & Basics
Every trader dreams of earning quick profits from the stock market. Many beginners enter intraday trading or scalping believing that a few technical indicators will show perfect buy and sell signals.
Unfortunately, reality is very different. The truth is that no technical indicator can guarantee profits. Indicators are simply tools that help traders understand price behaviour. They reduce uncertainty, but they never remove risk completely.
At Alfinz, we regularly meet traders who install ten or more indicators on their charts. Instead of making better decisions, they become confused because every indicator gives a different signal.
That is why learning the best technical indicators for short-term trading is far more valuable than using every indicator available on your trading platform.
In this guide, we will explain how professional traders use technical indicators, which ones work best for short-term trading, and how to combine them without making your charts complicated.
Whether you are a beginner or someone trying to improve your intraday results, this article will help you understand technical analysis in simple and practical language.
Why Is It Important to Use Technical Indicators in Short-Term Trading?
Short-term trading moves very quickly. Prices can rise or fall within minutes.
Unlike long-term investing, traders do not have enough time to analyse company fundamentals before entering every trade. This is where technical indicators become useful.
They help traders understand price momentum, trend direction, buying pressure, selling pressure, volatility, and possible reversal zones.
Instead of making emotional decisions, traders can use indicators to make more disciplined trading decisions.
However, indicators should support your analysis—not replace your thinking.
Professional traders won’t rely just on a single signal. Instead, they combine price action, market structure, volume, and technical indicators before taking a trade.
Learning this approach can significantly improve consistency over time.
Real-Life Indian Scenario
Imagine Rahul, an IT employee from Hyderabad.
He watches YouTube videos every evening and starts intraday trading with ₹50,000.
On Monday, he installs RSI.
On Tuesday, he adds MACD.
By Wednesday, he has EMA, Super trend, Bollinger Bands, ADX, Stochastic RSI, Fibonacci levels, and Volume indicators on the same chart.
Whenever one indicator says “Buy,” another says “Sell.”
Rahul becomes confused.
- He enters trades late.
- He exits early.
- He blames the indicators.
But, the real problem is not the indicators. The problem is using too many indicators without understanding their purpose.
After learning how professional traders combine just two or three complementary indicators, Rahul begins making more disciplined decisions and avoids unnecessary trades.
This situation is very common among Indian retail traders.

The Reality of Short-Term Trading (Scalping and Day Trading)
Many social media influencers make short-term trading look easy.
A few screenshots showing large profits can create unrealistic expectations.
In reality, professional scalping and day trading require discipline, speed, preparation, and risk management.
Every trading day brings different market conditions.
Sometimes the market trends strongly, Sometimes it moves sideways & Sometimes it becomes extremely volatile after important news announcements.
No single indicator can perform equally well in every situation. Experienced traders understand this.
Instead of searching for a magical indicator, they first identify the current market condition and then choose suitable trading tools.
This mind-set separates consistent traders from emotional traders.
Scalping Requires Fast Decision Making
Scalping focuses on capturing very small price movements.
Trades may last only a few seconds or minutes.
Because decisions happen quickly, traders usually prefer fast-moving indicators like:
- 9 EMA
- 21 EMA
- VWAP
- RSI
- Volume
These indicators respond quickly to changing market momentum.
However, quick signals also create more false signals. Therefore, proper confirmation becomes essential.
Day Trading Needs Balance
Day traders generally hold positions longer than scalpers.
Trades may remain open for thirty minutes, one hour, or until market closing.
Day traders often combine trend-following indicators with momentum indicators.
This combination reduces unnecessary entries while improving trade quality.
The goal is not to take more trades. The goal is to take better trades.
Short-Term Trading Is About Probability
Many beginners ask,
“Which indicator gives 100% accuracy?”
Unfortunately, none.
Every indicator only increases the probability of making a successful decision.
Even professional traders lose trades regularly.
Their success comes from managing losses and allowing winning trades to grow.
Understanding this simple truth changes the entire trading mind-set.
Why Technical Indicators Matter (and Their Limitations)
Technical indicators convert raw market data into readable signals.
Instead of analysing thousands of price movements manually, traders can quickly understand whether buyers or sellers currently have more control.
Indicators help answer questions like:
- Is momentum increasing?
- Is the trend strong?
- Is volatility expanding?
- Is volume supporting this breakout?
- Is price overbought or oversold?
These answers help traders build confidence before entering a position.
However, technical indicators also have limitations.
Most indicators are based on historical price data.
They react after price moves.They do not predict the future.
This is why traders should always analyse price action along with indicators.
Indicators Should Support Price Action
Think of technical indicators like a car’s dashboard.
- The speedometer tells you how fast you’re travelling.
- The fuel gauge shows the remaining fuel.
- The engine temperature warns about overheating.
But ,none of these controls the car. The driver still has to make decisions.
Similarly, indicators provide information. The trader makes the final decision.
This simple understanding prevents overdependence on indicators.
News Can Override Every Indicator
Imagine the market looks perfectly bullish.
- EMA is rising.
- MACD gives a buy signal.
- RSI shows healthy momentum.
Suddenly, RBI announces an unexpected policy decision.
Within minutes, the market falls sharply.
Every bullish indicator fails.
This happens because news creates fresh information that indicators cannot predict.
Therefore, traders should always monitor important economic events before entering short-term trades.
Indicators Work Better Together
Each indicator measures something different.
- Some identify momentum.
- Some identify trend.
- Others measure volatility.
- Some confirm participation through volume.
Combining different categories improves decision quality.
Using five momentum indicators together usually creates confusion instead of clarity.
Professional traders focus on complementary information rather than duplicate information.
Setting Realistic Expectations for Technical Analysis
Technical analysis is often misunderstood.
Many beginners believe learning indicators alone will make them profitable.
But, Reality is different.
Technical analysis improves decision-making. It does not guarantee profits.
Think of it like weather forecasting. Meteorologists use advanced models to predict rain.
- Sometimes they are right.
- Sometimes weather changes unexpectedly.
Similarly, technical indicators estimate the most likely market direction.
Markets can still surprise everyone.
Consistency Is More Important Than Accuracy
Professional traders rarely aim for perfect accuracy.
Instead, they focus on consistent execution.
Even a trading strategy with a 50–60% win rate can become profitable if losses remain small and profits are allowed to grow.
This principle is far more important than finding the “perfect indicator.”
Practice Builds Confidence
Reading about indicators is only the first step.
Real improvement comes through practice.
Every trader should:
- Backtest historical charts.
- Trade on a demo account.
- Maintain a trading journal.
- Review mistakes weekly.
- Improve one strategy at a time.
This disciplined approach builds confidence and reduces emotional decision-making.

Core Categories of Short-Term Technical Indicators
Not every indicator performs the same job.
Professional traders classify indicators into different categories based on the type of information they provide.
Understanding these categories helps traders choose the right tool for the right market situation.
1. Momentum Oscillators – Catching Sudden Speed Bursts
Momentum indicators tell us how quickly prices are moving.
They help traders identify whether buying or selling pressure is increasing or weakening.
Momentum indicators are especially useful during intraday reversals and breakout trading.
Popular momentum indicators include:
- Relative Strength Index (RSI)
- Stochastic Oscillator
- MACD Histogram
These indicators often signal early changes in momentum before price trends become obvious.
However, momentum indicators perform best when combined with trend confirmation.
2. Trend-Following Tools – Riding the Immediate Wave
Trend indicators help identify whether the market is moving upward, downward, or sideways.
Trading with the trend generally improves the probability of success.
Some of the most trusted trend indicators include:
- Exponential Moving Average (EMA)
- Moving Average Convergence Divergence (MACD)
- Supertrend
- Moving Average Crossovers
Rather than predicting reversals, trend indicators encourage traders to stay with the prevailing market direction.
This reduces emotional decision-making.
3. Volume Indicators – Confirming the Validity of a Move
Price alone gives only little information about the story.
Volume reveals how strongly market participants support a move.
A breakout supported by high trading volume is usually more reliable than one with weak participation.
Popular volume-based tools include:
- VWAP
- Volume Bars
- On-Balance Volume (OBV)
Professional traders often wait for volume confirmation before entering breakout trades.
4. Volatility Indicators – Measuring the Size of Price Swings
Volatility indicators estimate how much prices are likely to move.
High volatility creates larger opportunities but also increases risk.
Low volatility often precedes explosive breakouts.
Common volatility indicators include:
- Bollinger Bands
- Average True Range (ATR)
- Keltner Channels
These indicators help traders decide where to place stop-losses and profit targets more effectively.
What’s Coming Next?
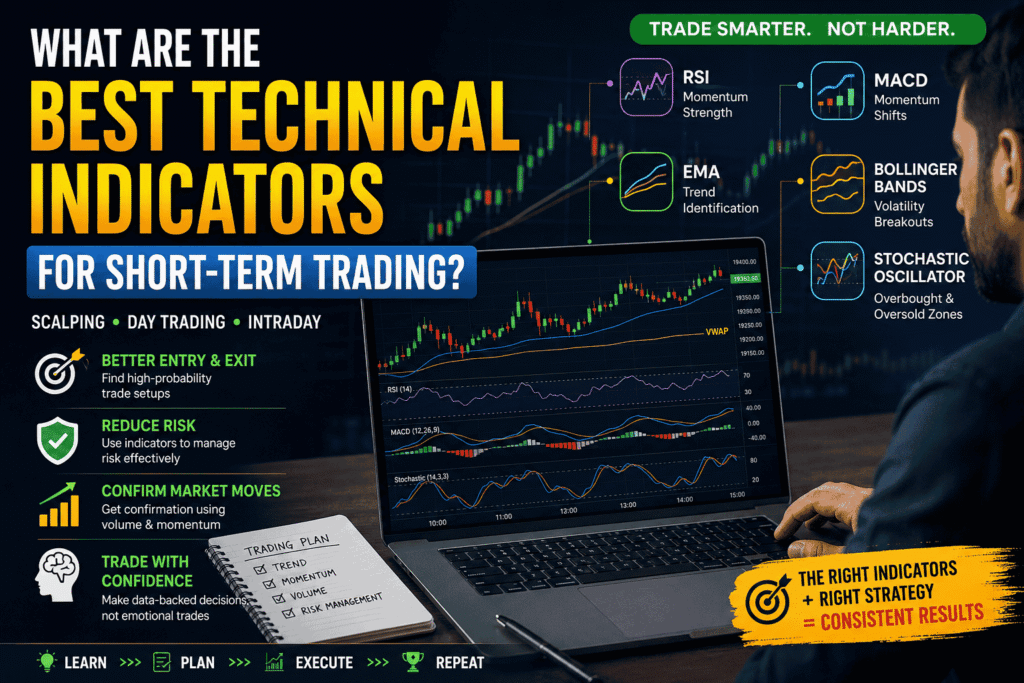
Now that we’ve understood the different categories of technical indicators, the next part will explain the six best technical indicators for short-term trading in detail, including:
- Relative Strength Index (RSI)
- MACD
- 9 EMA & 21 EMA
- Bollinger Bands
- VWAP
- Stochastic Oscillator
Each indicator will include:
- How it works
- Best settings
- Advantages
- Limitations
- Real-life Indian trading examples
- Common mistakes beginners should avoid
- Practical tips from trading experience
Continue Reading: Which Technical Indicators Work Best for Short-Term Trading? Learn RSI, MACD, EMA, VWAP & More.
What are the Best Technical Indicators for Short-Term Trading? Part-2
earn RSI, MACD, EMA, VWAP & More
What are the Best Technical Indicators for Short-Term Trading? Part-3
Strategy & Execution
Contact Alfinz Today for Personalized Investment Guidance Before You Start Investing
Need personalized financial guidance?
Contact Alfinz today for Investments, Insurance, Loans, Taxation & Financial Planning assistance.
Disclaimer: This article is published for general educational and informational purposes only. The content shared is based on common financial planning principles and personal finance awareness. It should not be considered professional financial, investment, tax, legal, or insurance advice. Financial decisions should always be made based on individual goals, risk profile, income, and personal circumstances. Readers are advised to consult a qualified financial advisor or professional before making any financial or investment decisions. Alfinz shall not be responsible for any financial loss or decisions taken based on this content.

Shiva Kumar is the Founder of ALFINZ, a financial planning and investment advisory platform dedicated to helping individuals make informed financial decisions. He holds NISM certifications in Equity Derivatives, Currency Derivatives, Equity Research Analysis, and Mutual Fund RTA. Through ALFINZ, he shares practical insights on financial planning, stock market investing, mutual funds, insurance, taxation, and wealth creation.