
Chart Patterns & Chart-Based Trading
A chart patterns is nothing more than the footprint left behind by thousands of market participants. When the same behaviour repeats again and again, the pattern also repeats.
However, chart patterns are not magic. They simply improve the probability of making better trading decisions when combined with volume, risk management, and market trend.
Many beginners enter the stock market after hearing tips from friends, social media, or television. Sometimes they make profits, but many times they enter too late or exit too early.
That is exactly where the best chart patterns for stock entry and exit become valuable. They help traders understand what buyers and sellers are doing before making a decision.
In our experience, traders who patiently wait for quality chart patterns generally avoid emotional decisions and improve consistency over time.
Why Learning Chart Patterns Is Important
Technical analysis is less about predicting tomorrow’s price and more about managing today’s risk
Instead, it helps you identify high-probability opportunities while controlling risk.
Understanding chart patterns can help you:
- Find better entry prices
- Exit before momentum weakens
- Avoid emotional buying
- Reduce unnecessary losses
- Improve risk management
- Increase trading confidence
Most importantly, chart patterns provide a structured trading plan instead of random guesses.
The Psychology of Price Action
Every candlestick on a chart represents a battle between buyers and sellers.
When buyers dominate, prices move higher.
When sellers dominate, prices fall.
Chart patterns simply show how this battle is developing.
For example, repeated rejection near one price level shows sellers are becoming stronger.
Similarly, repeated support at one level indicates buyers are protecting that price.
Understanding this psychology helps traders enter with confidence instead of fear.
Why Chart Patterns Dictate Entry and Exit Points
Most institutional traders don’t buy randomly.
They wait for confirmation.
Chart patterns highlight important areas where supply and demand change.
These areas usually become:
- Breakout zones
- Breakdown zones
- Reversal zones
- Trend continuation zones
Therefore, identifying these zones early gives traders better entry and exit opportunities.
Reversal Patterns for Trend Shifts
Reversal patterns signal that an existing trend may be ending.
Let’s understand the most reliable ones.
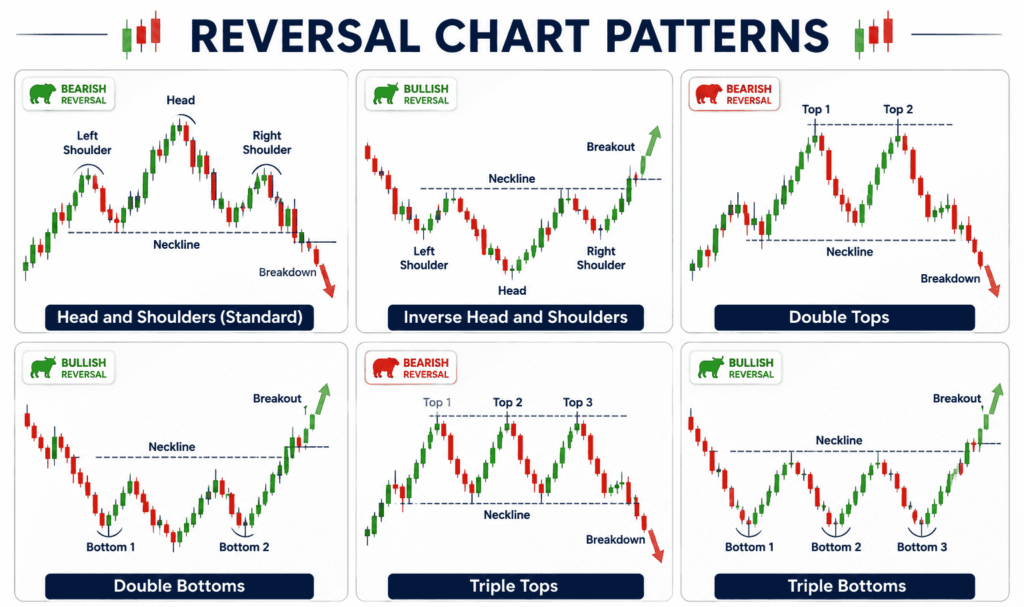
Head and Shoulders (Standard & Inverse)
- The Head and Shoulders pattern often appears after a strong uptrend.
It consists of:
- Left Shoulder
- Head
- Right Shoulder
- Neckline
A breakdown below the neckline indicates potential trend reversal.
- The Inverse Head and Shoulders works exactly opposite and indicates bullish reversal after a downtrend.
Always wait for volume confirmation before entering
Double Tops and Double Bottoms
- A Double Top forms after an uptrend.
Price fails twice near the same resistance level before falling.
- A Double Bottom forms after a downtrend.
Price finds support twice before moving upward.
These are among the easiest patterns for beginners.
However, entering before neckline breakout increases failure probability.
Triple Tops and Triple Bottoms
These patterns are similar to Double Tops and Bottoms but involve three tests of the same level.
Because multiple rejections occur, the breakout often becomes stronger.
Nevertheless, confirmation remains essential.

Continuation Patterns for Trend Retesting
Not every pause means trend reversal.
Sometimes markets simply take rest before continuing.
These patterns help identify that situation.
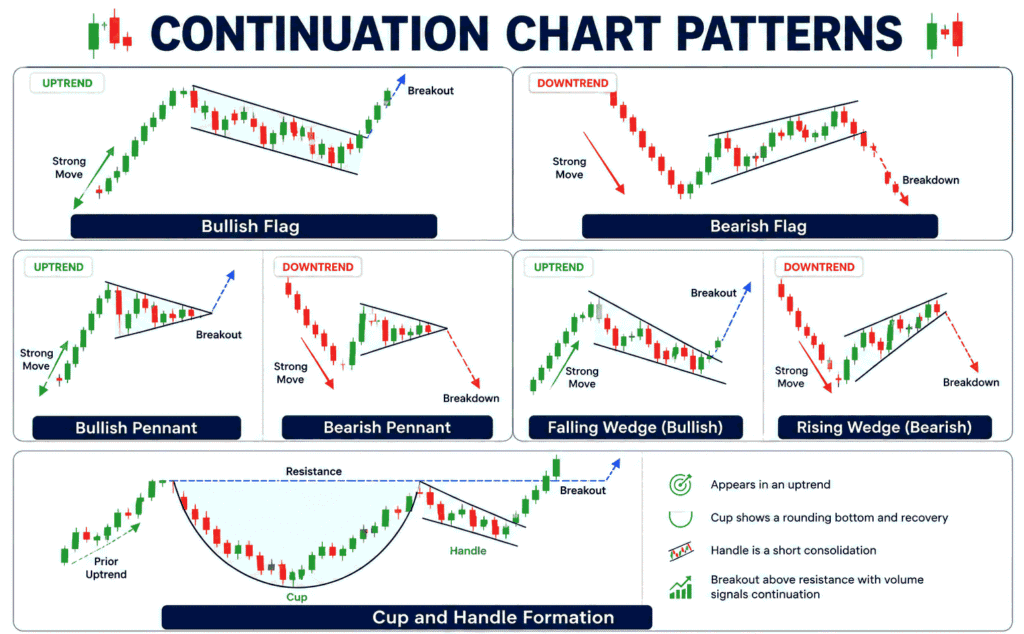
Bullish and Bearish Flags
After a sharp price move, stocks often consolidate inside a small break.
This creates a Flag pattern.
- Bullish Flags continue upward.
- Bearish Flags continue downward.
Volume generally declines during consolidation and increases sharply during breakout. That increase in volume confirms the continuation.
Pennants and Wedges
- Pennants resemble small triangles after a strong move.
They usually break in the direction of the previous trend.
- Wedges are slightly different.
A Falling Wedge usually indicates bullish continuation or reversal.
A Rising Wedge often signals bearish movement. Again, breakout volume plays a major role.
Cup and Handle Formation
The Cup and Handle is considered one of the strongest bullish continuation patterns.
The rounded cup reflects gradual accumulation.
The handle represents short-term profit booking.
Once the handle breaks with strong volume, momentum often accelerates.
Many quality Indian stocks have formed Cup and Handle patterns before significant rallies.
Bilateral Patterns for Breakthrough Traps
Sometimes the market itself is uncertain.
These patterns prepare traders for movement in either direction.
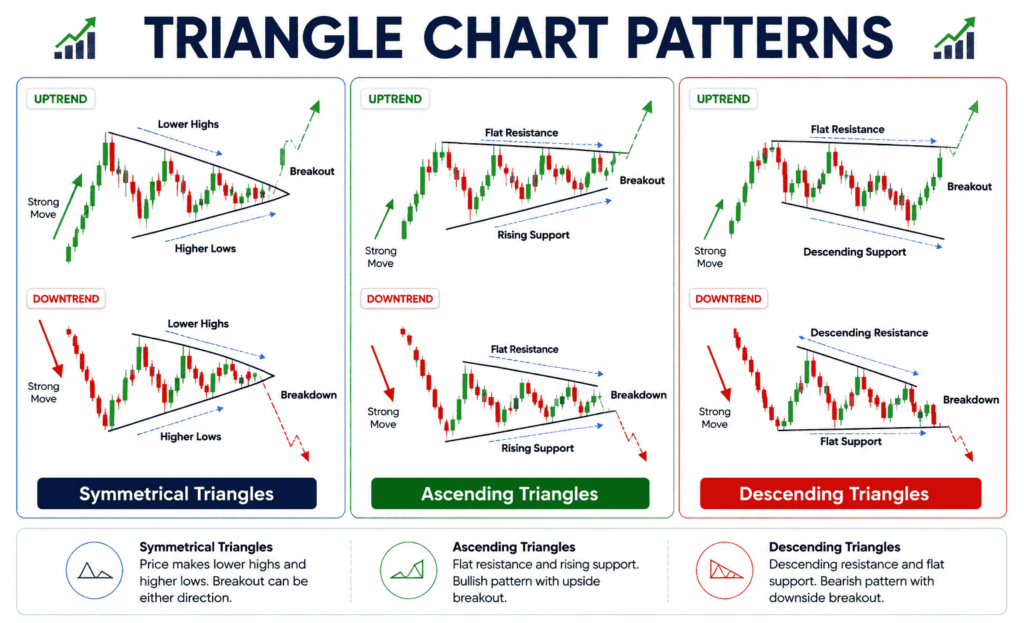
Symmetrical Triangles
Both buyers and sellers gradually lose control.
Eventually, price breaks one side.
Instead of predicting direction, traders should wait for breakout confirmation.
Patience reduces unnecessary losses.
Ascending and Descending Triangles
Ascending Triangle : Usually bullish.
- Flat resistance
- Rising support
Descending Triangle : Usually bearish.
- Flat support
- Falling resistance
However, confirmation remains more important than prediction.
Execution Mastery: Precision Entry Rules
Knowing patterns alone is not enough.
Execution decides profitability.
The Breakout Entry
Many traders enter immediately after price breaks resistance.
This works well when:
- Breakout candle closes above resistance
- Volume is significantly higher
- Market trend supports the move
Never enter during the middle of a breakout candle.
Wait for candle close. This reduces false breakout risk.
*The Retest Entry*
Professional traders often prefer waiting.
After breakout, price frequently revisits the breakout level.
If support holds again, the probability improves.
Although this entry may miss some trades, it usually reduces unnecessary losses.

Protection and Profit: Precision Exit Rules
Important: “Successful trading depends more on exits than entries.”
Stop-Loss Placement
Always define risk before entering.
Good stop-loss locations include:
- Below breakout candle
- Below recent swing low
- Below support
- Above resistance in short trades
Note :
Never shift stop-loss emotionally.
Capital protection comes first.
Execution should be very fast, because stop loss execution test will be sudden & fast
Profit Targets Using Measured Move Rules
One of the best techniques is the Measured Move Target.
Formula
Pattern Height = Resistance – Support
Expected Target = Breakout Point + Pattern Height
Example
Triangle Height: Rs.40
Breakout at: Rs.500
Target: Rs.540
This method gives objective profit targets instead of emotional decisions.
Trailing Stop Strategy
Markets do not move in straight lines.
Trailing stop helps lock profits.
Popular methods include:
- Previous swing low
- 20 EMA
- 9 EMA
- ATR Trailing Stop
Trailing stops allow winners to grow while limiting downside.
The Missing Ingredients for Pattern Success
Patterns alone cannot guarantee profits.
Several supporting factors improve accuracy.
Volume Confirmation
This is probably the most ignored factor by beginners.
A breakout without higher-than-average volume often fails.
High volume shows genuine buying or selling interest.
Low volume indicates weak participation.
Always combine chart patterns with volume analysis.
Timeframe Alignment
Professional traders rarely use only one timeframe.
Example
- Daily chart
- Overall trend
- Hourly chart
- 15-minute chart
- Fast execution
This Multi-Timeframe Analysis improves trade quality.
False Breakouts
False breakouts are common.
Price briefly crosses resistance before reversing sharply.
To reduce this risk:
- Wait for candle close
- Check breakout volume
- Confirm broader market trend
- Avoid chasing candles
- Wait for retest whenever possible
Patience often saves capital.
Risk Management Rules Every Trader Should Follow
Even the best chart pattern fails occasionally.
Therefore:
- Risk only 1% of capital per trade.
- Maintain a minimum 1:2 Risk-Reward Ratio.
- Never average losing trades.
- Avoid overtrading.
- Follow your trading plan consistently.
- Never allow emotions in trading.
Long-term success depends more on discipline than prediction.
Market Context Matters
Many traders ignore the overall market.
That is a costly mistake.
Even the strongest bullish chart pattern performs better when:
- Nifty 50 is bullish
- Sector trend is positive
- Volume supports breakout
Likewise, bearish patterns perform better during weak market conditions.
Trading with the broader trend significantly improves probability.
Real-Life Indian Scenario
Imagine Ramesh from Hyderabad.
He noticed a Double Bottom pattern in a banking stock.
Instead of buying immediately, he waited for:
- Breakout candle close
- Higher trading volume
- Positive Bank Nifty trend
He entered only after confirmation.
His stop-loss remained below support.
He booked profits using measured move targets.
Although every trade cannot become profitable, following rules helped him avoid emotional decisions.
This disciplined approach is what separates consistent traders from gamblers.
Alfinz -Based Approach
Every trader has a different:
- Risk appetite
- Capital size
- Trading style
- Time availability
Therefore, no single chart pattern works for everyone.
At ALFINZ, we believe education comes before execution.
Learning how to combine chart patterns with volume, market trend, and risk management can improve decision-making and reduce costly mistakes.
Instead of blindly following tips, build a trading process that suits your goals.
FAQ‘s
Double Bottom, Double Top, Flags, and Cup & Handle are easier to understand and identify.
No. They only increase probability.
Proper risk management remains essential.
Strong volume confirms institutional participation.
Low-volume breakouts often fail.
A minimum 1:2 Risk-Reward Ratio is recommended.
No. Wait for the candle to close outside the pattern.
Retest entries are often safer.
Daily charts for trend.
Hourly charts for entries.
15-minute charts for precision execution.
They work better when aligned with the broader market trend and sector strength.
Conclusion:
Learning the Best Chart Patterns for Stock Entry and Exit is one of the smartest investments a trader can make.
However, chart patterns alone cannot guarantee profits.
Think of a chart pattern as just a basic blueprint—volume, stop-losses, and market trends are the actual tools that build a safe, winning trade
Most importantly, remain patient.
Professional traders do not chase every move.
They wait for high-quality opportunities supported by strong evidence.
Remember, consistent profits come from following a well-tested trading plan—not from predicting every market move.
What are the Best Technical Indicators for Short-Term Trading?
-:Stop Guessing Your Stock Entries! Learn to Trade with Confidence:-
Every delayed entry or emotional exit can cost real money.
Don’t let avoidable mistakes damage your trading capital.
Connect with ALFINZ today for practical guidance on technical analysis, chart reading, risk management, and building a disciplined trading approach.
👉 Start your learning journey today and make informed trading decisions instead of emotional ones.
Contact Alfinz Today for Personalized Investment Guidance Before You Start Investing
Need personalized financial guidance?
Contact Alfinz today for Investments, Insurance, Loans, Taxation & Financial Planning assistance.
Disclaimer: This article is published for general educational and informational purposes only. The content shared is based on common financial planning principles and personal finance awareness. It should not be considered professional financial, investment, tax, legal, or insurance advice. Financial decisions should always be made based on individual goals, risk profile, income, and personal circumstances. Readers are advised to consult a qualified financial advisor or professional before making any financial or investment decisions. Alfinz shall not be responsible for any financial loss or decisions taken based on this content.

Shiva Kumar is the Founder of ALFINZ, a financial planning and investment advisory platform dedicated to helping individuals make informed financial decisions. He holds NISM certifications in Equity Derivatives, Currency Derivatives, Equity Research Analysis, and Mutual Fund RTA. Through ALFINZ, he shares practical insights on financial planning, stock market investing, mutual funds, insurance, taxation, and wealth creation.