
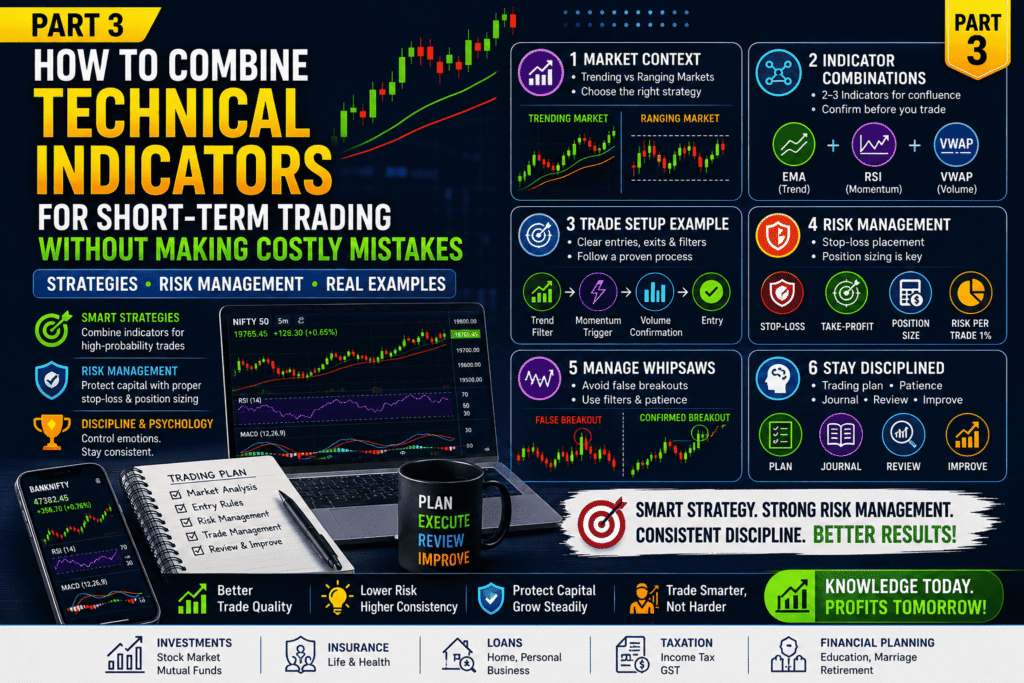
Combing Technical Indicators for Short-Term Trading: Strategy & Execution
Most beginners think that “using more technical indicators increases accuracy”. Unfortunately, the opposite is usually true.
At Alfinz, we believe a clean chart helps you make faster and better decisions than a chart filled with confusing signals.
If you haven’t read our previous articles, please explore
What are the Best Technical Indicators for Short-Term Trading? Part-1
Overview & Basics
What are the Best Technical Indicators for Short-Term Trading? Part-2
Learn RSI, MACD, EMA, VWAP & More
The Danger of Multiple indicators
Professional traders prefer a simple trading system that provides clear and repeatable signals. Instead of adding ten indicators, they focus on two or three that complement each other.
Many indicators calculate similar information using different formulas.
This creates indicator duplicity, also known as multicollinearity.
For example:
- RSI measures momentum.
- Stochastic Oscillator also measures momentum.
- MACD partly measures momentum.
Using all three together may look impressive, but they often provide similar signals. This does not increase accuracy. Instead, it creates confusion.
Imagine asking three friends who always agree with each other. You are not getting three independent opinions. You are hearing the same opinion in different words.
The same happens with technical indicators.
A Better Approach
Choose indicators from different categories.
For example:
| Purpose | Indicator |
| Trend | 9 EMA & 21 EMA |
| Momentum | RSI |
| Volume | VWAP |
| Volatility | Bollinger Bands |
Each indicator contributes unique information.
How to Combine Indicators (Building a Trading System)
The Two-Indicator Rule: Confluence Without Confusion
One of the simplest trading principles is the Two-Indicator Rule.
Wait for two independent confirmations before entering a trade.
This reduces emotional trading and improves decision quality.
Example:
Trend Confirmation:
- Price above 21 EMA
Momentum Confirmation:
- RSI crosses above 50
If both conditions are satisfied, the probability of a successful trade generally improves.
This does not guarantee profits. However, it reduces low-quality trades.

Step-by-Step Example: Combining a Trend Filter with a Momentum Trigger
Let’s understand a practical intraday setup.
Step 1
Open a 5-minute chart.
Step 2
Apply:
- 9 EMA
- 21 EMA
- RSI (14)
Step 3
Check the trend.
If price remains above both EMAs,
Look only for buying opportunities.
Ignore short-selling.
Step 4
Wait patiently.
Do not chase price.
Allow the market to pull back.
Step 5
When RSI rises above 50 after the pullback,
Prepare for entry.
Step 6
Confirm with a bullish candle and healthy trading volume.
Step 7
Place your stop-loss below the recent swing low.
Step 8
Trail profits using the 9 EMA until momentum weakens.
This simple system keeps traders disciplined and avoids unnecessary trades.
Real-Life Indian Example
Suppose HDFC Bank opens with a strong gap-up.
- The stock trades above VWAP.
- The 9 EMA remains above the 21 EMA.
- RSI moves above 55.
- Volume remains higher than average.
Instead of buying immediately after the gap-up, experienced traders wait for a small pullback.
When the stock bounces from the 21 EMA with rising volume, they consider entering the trade.
This approach reduces emotional entries and improves risk-reward.
Critical Factors for Short-Term Execution
Even the best technical indicators fail if traders ignore market conditions.
Execution is equally important.
Selecting the Right Timeframes (1-Minute to 15-Minute Charts)
Different traders use different chart intervals.
Each timeframe has advantages and disadvantages.
1-Minute Chart
Suitable for:
- Professional scalpers
Advantages:
- Many trading opportunities
Disadvantages:
- High market noise
- Frequent false signals
3-Minute Chart
Suitable for:
- Active intraday traders
Provides a balance between speed and reliability
5-Minute Chart
One of the most popular choices.
Suitable for beginners. Provides cleaner trends with fewer false signals.
15-Minute Chart
Best for:
- Conservative intraday traders
Signals are slower but generally more reliable.
Our Recommendation
If you are new to trading,
Start with:
- 5-minute chart
- 9 EMA
- 21 EMA
- RSI
- VWAP
Master one setup before experimenting with advanced strategies.
Market Context: Trending (Up/Down) vs Range bound (Sideways)
One strategy cannot perform well in every market. Understanding market context improves trading accuracy.
Trending Market
Characteristics:
- Higher Highs/Lower Highs
- Higher Lows/Lower lows
- Strong volume
- EMA alignment
Best Indicators:
- EMA
- MACD
- VWAP
Range-Bound Market
Characteristics:
- Sideways movement
- Low volatility
- Repeated support and resistance
Best Indicators:
- RSI
- Stochastic Oscillator
- Bollinger Bands
Why Context Matters
Imagine using Bollinger Band reversal strategies during a strong uptrend.
You may repeatedly sell a rising market.
Similarly,
Buying every RSI oversold signal during a strong downtrend can become expensive.
Always identify the market condition before choosing your strategy.
Managing False Signals
Every trader experiences false signals.
Professional traders accept them as part of trading.
Instead of avoiding every loss,
They manage them effectively.
Common Reasons for False Signals
- Low trading volume
- News announcements
- Opening market volatility
- Sideways movement
- Low liquidity stocks
Ways to Reduce False Signals
- Wait for candle closing.
- Avoid impulsive entries.
- Confirm with volume.
- Trade liquid stocks.
- Avoid major news events.
- Trade in the direction of the strong trend.

Risk Management: The True Secret to Short-Term Success
Indicators help identify opportunities.
Risk management protects trading capital.
Without risk management,
Even the best indicators become useless.
Setting Indicator-Based Stop-Losses
Instead of random stop-losses,
Use logical market levels.
Examples:
Long Trade:
Stop-loss below:
- 21 EMA
- Recent swing low
- VWAP support
Short Trade:
Stop-loss above:
- Recent swing high
- VWAP resistance
- EMA resistance
This approach aligns risk with market structure.
Determining Take-Profit Targets Using Volatility
Many traders exit winning trades too early.
Volatility indicators help avoid this mistake.
Average True Range (ATR) or Bollinger Bands can estimate realistic price movement.
Example:
If ATR suggests Rs.12 average movement,
Expecting Rs.40 profit may be unrealistic.
Reasonable expectations improve consistency.
Why No Indicator Works Without Proper Position Sizing
This is perhaps the most overlooked topic.
Professional traders first calculate risk.
Only then do they calculate position size.
Example:
Trading Capital: Rs. 2,00,000
Maximum Risk Per Trade: 1%
Maximum Loss Allowed: Rs. 2,000
If stop-loss equals Rs.20,
Maximum Quantity: 100 shares This keeps every trade under control.
Golden Rule
Protect capital first.
Profits come later.
A trader who survives difficult market conditions always gets another opportunity.
Importance of Discipline in Short-Term Trading
Many traders lose money because of emotions rather than poor analysis.
Fear causes early exits.
Greed leads to oversized positions.
Revenge trading destroys discipline after a loss.
The best technical indicators cannot fix emotional mistakes. A written trading plan, consistent execution, and patience are often more valuable than discovering a new indicator.
Real-Life Indian Scenario
Consider Priya, a software engineer from Bengaluru.
She began intraday trading with Rs.1 lakh and initially followed random social media tips. Some trades generated profits, but many ended in avoidable losses because she entered without a plan.
After learning to use only EMA, VWAP, and RSI, she stopped taking impulsive trades. She also limited her risk to 1% per trade and maintained a trading journal.
Her profits did not become extraordinary overnight. However, her losses became smaller, her confidence improved, and she started making decisions based on a structured process instead of emotions.
This gradual improvement reflects the journey of many successful traders.
Alfinz – Based Approach
Every trader has different goals, risk tolerance, trading capital, and available time.
A strategy that suits a full-time trader may not be suitable for a working professional.
Before choosing any trading setup, consider:
- Your experience level
- Available trading hours
- Capital allocation
- Maximum acceptable loss
- Psychological comfort with volatility
If you are unsure where to begin, start with a simple strategy, backtest it thoroughly, and practise it on a demo account before risking real money.
FAQs
There is no single best indicator. Many traders combine EMA, RSI, and VWAP because each provides different insights about trend, momentum, and price strength.
No. RSI is useful for measuring momentum, but it should be combined with price action, trend analysis, and volume confirmation.
The 5-minute chart is generally a good starting point because it offers a balance between trading opportunities and reduced market noise.
No. Technical indicators improve decision-making but cannot predict the market with complete accuracy.
For most traders, two or three complementary indicators are enough. Adding multiple indicators often leads to confusion.
No. Wait for confirmation, check market conditions, and follow your trading plan. Quality trades are more important than frequent trades.
Yes. Consistent position sizing, stop-loss placement, and disciplined execution play a greater role in long-term success than any individual indicator.
Conclusion:
The best technical indicators for short-term trading are not magical tools that guarantee profits. Instead, they help traders understand market behaviour, identify trends, measure momentum, confirm volume, and manage volatility.
Indicators like RSI, MACD, EMA, VWAP, Bollinger Bands, and the Stochastic Oscillator each serve a specific purpose. When used together with proper market context and disciplined risk management, they can improve trading decisions.
Remember, successful trading is not about predicting every market move. It is about managing risk, following a tested strategy, and staying consistent over time.
Before risking real money, back test your setup, practise on a demo account, maintain a trading journal, and focus on continuous learning. Over time, these habits can help you become a more confident and disciplined trader.
⚠️ Stop Trading on Random Tips! Build a practical & paper trade strategy Before You Risk Your Money
Thousands of traders lose money because they rely on social media tips, unverified Telegram groups, or a single indicator.
Don’t let emotions control your trading decisions.
Contact Alfinz Today for Personalized Investment Guidance Before You Start Investing
Need personalized financial guidance?
Contact Alfinz today for Investments, Insurance, Loans, Taxation & Financial Planning assistance.
Disclaimer: This article is published for general educational and informational purposes only. The content shared is based on common financial planning principles and personal finance awareness. It should not be considered professional financial, investment, tax, legal, or insurance advice. Financial decisions should always be made based on individual goals, risk profile, income, and personal circumstances. Readers are advised to consult a qualified financial advisor or professional before making any financial or investment decisions. Alfinz shall not be responsible for any financial loss or decisions taken based on this content.

Shiva Kumar is the Founder of ALFINZ, a financial planning and investment advisory platform dedicated to helping individuals make informed financial decisions. He holds NISM certifications in Equity Derivatives, Currency Derivatives, Equity Research Analysis, and Mutual Fund RTA. Through ALFINZ, he shares practical insights on financial planning, stock market investing, mutual funds, insurance, taxation, and wealth creation.