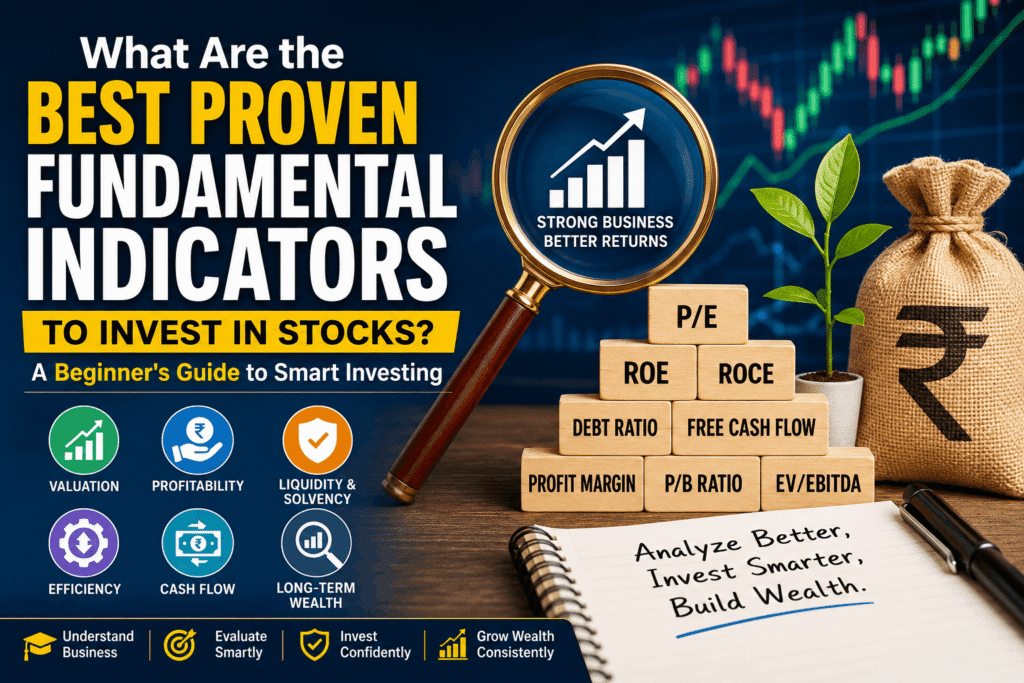
A Beginner’s Guide with best Fundamental Indicators to Invest in Stocks?
Investing in stocks is exciting. But, long term investors need best Fundamental indicators to invest in good stocks.
However, excitement alone cannot build wealth. Many beginners buy shares because of social media trends, television tips, or friends’ recommendations. Unfortunately, such decisions often lead to losses.
In our experience of discussing investments with hundreds of Indian investors, we have noticed one common pattern. Most people spend more time checking daily stock prices than understanding the actual business behind those stocks.
That approach usually creates emotional decisions instead of logical investments.
Fortunately, there is a better way.
Fundamental analysis helps investors understand whether a company is financially strong, consistently profitable, and capable of creating wealth over many years. Instead of following market noise, it focuses on business quality.
This guide explains the best proven fundamental indicators to invest in stocks in simple Indian English. Whether you are a beginner or an experienced investor, these indicators can help you make better long-term investment decisions.
Why Are Fundamental Indicators Important Before Investing?
Imagine purchasing a house worth Rs.80 lakhs without checking its documents, location, construction quality, or legal approvals.
Would you do that? Probably not…
Then why invest in a company’s shares without understanding its financial health?
Fundamental indicators act like a health check-up for a business. They help investors evaluate profitability, debt, valuation, efficiency, and future growth potential before investing.
As a result, investors can avoid weak companies and identify businesses capable of generating long-term wealth.
What is Fundamental Analysis?
Fundamental analysis is the process of studying a company’s financial statements, management quality, business model, competitive advantage, industry position, and economic outlook.
Instead of predicting tomorrow’s stock price, it answers one important question:
“Is this company worth investing in?”
The answer comes from carefully analysing numbers that reflect the company’s actual performance.
Why Business Health Matters More Than Market Noise
Every day the stock market reacts to news, politics, global events, and investor emotions.
However, strong businesses usually continue growing despite temporary market volatility.
History has repeatedly shown that companies with healthy financials eventually reward patient investors.
Therefore, understanding business fundamentals is much more valuable than chasing short-term price movements.
Understanding Intrinsic Value
Every company has two values.
1. One is the market price.
2. The other is its intrinsic value.
Market price changes every second because buyers and sellers constantly trade.
Intrinsic value represents what the business is actually worth based on its earnings, assets, growth, and future cash flows.
When a stock is available for much less than it is actually worth (intrinsic value), it is often a great time to buy. That is why legendary investors always focus on value rather than popularity.
Also Read: The Ultimate Beginner’s Guide to Stock Market Investing in India
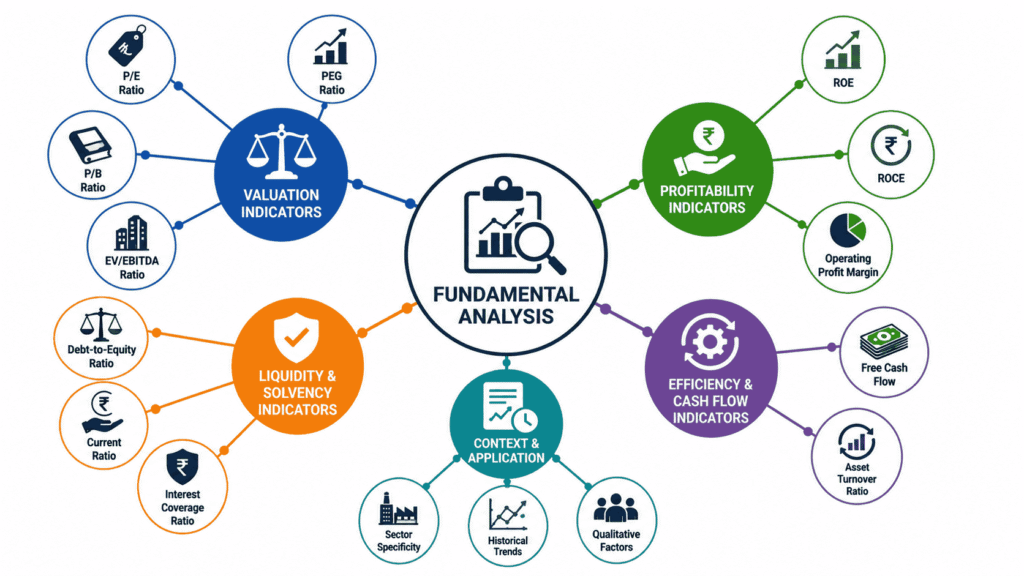
Valuation Indicators: Is the Stock Cheap or Expensive?
A great company is not always a great investment.
Buying an excellent business at an excessively high price can reduce future returns.
Therefore, valuation matters.
1. Price-to-Earnings (P/E) Ratio
P/E = Market Price per Share ÷ Earnings Per Share (EPS)
The P/E ratio shows how much investors are willing to pay for every rupee the company earns.
For example,
If a stock trades at Rs.1000 and earns Rs.50 per share, Then P/E = 20
This means investors are paying Rs.20 for every ₹1 of annual earnings.
General Interpretation
- Lower P/E may indicate undervaluation.
- Higher P/E may reflect future growth expectations.
- Compare only within the same industry.
For example, software companies usually trade at higher P/E ratios than steel companies.
Therefore, sector comparison is extremely important.
2. Price-to-Earnings Growth (PEG) Ratio
PEG = P/E ÷ Expected Earnings Growth
The PEG ratio improves the P/E ratio by considering future earnings growth.
Generally,
- Below 1 = Attractive valuation
- Around 1 = Fair valuation
- Above 1 = Relatively expensive
This indicator is particularly useful for fast-growing companies.
3. Price-to-Book (P/B) Ratio
P/B = Market Price ÷ Book Value per Share
The P/B ratio compares market value with the company’s net asset value.
This ratio is widely used while analysing:
- Banks
- NBFCs
- Insurance companies
- Financial institutions
If a quality bank trades close to its book value, investors often study whether it offers long-term value.
However, P/B alone should never be the final decision.
4. EV/EBITDA Ratio
Enterprise Value considers:
- Market capitalization
- Debt
- Cash Balance
EBITDA measures operating profitability.
EV/EBITDA helps investors compare companies regardless of their financing methods.
Professional investors frequently use this ratio while comparing businesses across similar industries.
It offers a more complete valuation picture than P/E in many situations.
Also Read: Beginner’s Guide to Mutual Funds Investing: Best Ways to Build Wealth
Profitability Indicators: How Efficiently Does the Business Generate Wealth?
Revenue alone does not create wealth. Profits do.
More importantly, sustainable profits matter even more.
5. Return on Equity (ROE)
ROE = Net Profit ÷ Shareholders’ Equity
ROE measures how effectively management uses shareholders’ money.
Generally,
- Above 15% is considered healthy.
- Consistency matters more than one exceptional year.
Companies with steadily improving ROE often indicate efficient management.
However, investors should also check debt because excessive borrowing can artificially increase ROE.
6. Return on Capital Employed (ROCE)
ROCE = EBIT ÷ Capital Employed
Many experienced investors prefer ROCE because it measures returns generated from total capital employed.
A consistently high ROCE usually reflects:
- Strong business model
- Efficient capital allocation
- Competitive advantage
Companies maintaining ROCE above 18–20% for several years often attract long-term investors.
7. Operating Profit Margin (OPM)
OPM = Operating Profit ÷ Revenue
Operating Margin measures profits generated before interest and taxes.
Higher operating margins generally indicate:
- Better pricing power
- Efficient operations
- Lower production costs
Companies with stable margins usually withstand economic slowdowns better than those with fluctuating margins.
Liquidity and Solvency Indicators: Is the Company Financially Safe?
Even profitable companies can struggle if debt becomes excessive.
Therefore, investors should always evaluate financial stability.
8. Debt-to-Equity Ratio (D/E)
D/E ratio = Total Debt ÷ Shareholders’ Equity
Generally,
Lower debt indicates lower financial risk.
However, acceptable debt levels differ across industries.
Capital-intensive sectors naturally carry higher borrowing.
Investors should compare companies only within similar sectors.
9. Current Ratio
Current Ratio = Current Assets ÷ Current Liabilities
This ratio measures short-term liquidity.
A Current Ratio above 1.5 indicates reasonable short-term financial strength.
Very low ratios may signal liquidity concerns.
10. Interest Coverage Ratio
Interest Coverage Ratio = EBIT ÷ Interest Expense
This ratio evaluates whether operating profits comfortably cover interest payments.
Higher ratios suggest stronger financial stability.
Companies struggling to pay interest often face greater financial risk during economic downturns.
Efficiency and Cash Flow Indicators: The Ultimate Reality Check
Accounting profits are useful.
Cash is even more important.
Cash keeps businesses alive.
11. Free Cash Flow (FCF)
Free Cash Flow represents money left after operating expenses and capital investments.
Positive FCF allows companies to:
- Expand operations
- Pay dividends
- Reduce debt
- Buy back shares
Consistently positive FCF is often a sign of a healthy business.
12. Asset Turnover Ratio
This ratio measures how efficiently a company generates sales using its assets.
Higher asset turnover generally indicates efficient resource utilisation.
Manufacturing businesses often have lower turnover compared to retail businesses.
Again, industry comparison remains essential.

Real-Life Indian Scenario
Consider two imaginary companies.
Company A appears everywhere on social media. Everyone talks about its rising stock price.
Company B rarely makes headlines. However, it consistently reports strong profits, healthy cash flow, low debt, and improving ROCE.
Many beginners invest in Company A because of excitement.
Experienced investors usually spend time studying Company B.
Five years later, Company B may quietly deliver better wealth creation because its business kept improving.
This situation happens regularly in Indian markets.
That is why disciplined investing often beats emotional investing.
How Should You Apply These Indicators?
Many beginners search for one magical ratio.
Unfortunately, no single indicator guarantees investment success.
Instead, experienced investors combine multiple indicators.
For example,
- Attractive valuation
- Healthy ROE
- Strong ROCE
- Positive cash flow
- Low debt
- Consistent profit growth
- Capable management
Together, these indicators provide a much stronger investment framework.
Sector-Specific Analysis Matters
One common mistake is comparing every company using identical benchmarks.
That approach creates misleading conclusions.
For example,
Technology companies generally have:
- Higher P/E
- Lower assets
- Strong margins
Banks usually require analysis using:
- P/B Ratio
- Net Interest Margin
- Gross NPA
- Capital Adequacy
Similarly,
Manufacturing businesses require different evaluation methods.
Therefore, always compare companies within the same industry.
Compare Historical Trends Instead of One-Year Numbers
A single year’s financial performance rarely tells the complete story.
Instead, review financial data for at least five to ten years.
Look for:
- Sales growth
- Profit growth
- ROE consistency
- ROCE improvement
- Debt reduction
- Cash flow stability
Long-term consistency often separates quality businesses from temporary performers.
Importance of Fundamental Analysis
Fundamental analysis protects investors from emotional decisions.
It encourages patience instead of speculation.
Moreover, it helps identify companies capable of delivering sustainable growth.
Long-term wealth creation usually comes from owning excellent businesses rather than frequently buying and selling stocks.
Therefore, every investor should learn the basics before investing hard-earned money.
Alfinz -Based Approach
Whenever clients approach us for stock selection, they often ask,
“Which stock should I buy?”
Instead of picking any stock, look at your financial goals, timeline, and risk level first.
Next, we evaluate businesses using proven fundamental indicators.
Finally, we shortlist companies that match both financial quality and the investor’s objectives.
This structured process reduces emotional investing and encourages disciplined wealth creation.
Remember, stock selection should always suit your financial plan, not someone else’s portfolio.
Best Fundamental Analysis Checklist:
Before investing, ask these questions.
✅ Is the company profitable?
✅ Is the debt under control?
✅ Is ROE consistently healthy?
✅ Is ROCE improving?
✅ Does the company generate positive Free Cash Flow?
✅ Are operating margins stable?
✅ Is the valuation reasonable?
✅ Has management delivered consistent growth?
✅ Does the company have a competition in the market?
✅ Would you feel comfortable holding this business for the next ten years?
If most of the answers are “Yes,” the company deserves little more research.
And, If most of the answers are “No,” then better ignore the company for investment.
FAQs
There is no single best indicator. Investors should analyse valuation, profitability, debt, cash flow, and growth together before making investment decisions.
No. Sometimes a low P/E indicates undervaluation. However, it may also signal poor future growth or business challenges. Always investigate the reason.
Generally, ROE above 15% is considered healthy.
However, consistency over many years matters more than one exceptional year.
Cash flow reflects the company’s actual financial strength. Strong cash flow supports expansion, dividends, debt repayment, and future growth.
Absolutely. Anyone willing to understand basic financial ratios and annual reports can gradually become a better investor. Learning step by step builds confidence.
No. Investors should also study management quality, industry outlook, competition, corporate governance, and future growth opportunities.
Numbers alone never tell the complete story.
Conclusion:
Successful investing is rarely about finding the next trending stock.
Instead, it is about identifying quality businesses before the market fully recognises their value.
The best proven fundamental indicators to invest in stocks help investors separate strong companies from weak ones through objective analysis.
Rather than depending on rumours or market excitement, focus on valuation, profitability, debt management, cash flow, and business efficiency.
Most importantly, combine multiple indicators instead of relying on only one ratio.
Over time, disciplined investing backed by strong fundamentals has consistently rewarded patient investors.
Remember, buying a stock means becoming a part-owner of a business. Therefore, always analyse the business before analysing the price.
Build a Strong Investment Portfolio Before It’s Too Late
Markets change every day, but your financial goals should never be left to chance.
If you’re confused about stock selection, portfolio review, or long-term wealth creation, don’t make decisions based on social media or market rumours.
Talk to a qualified financial planner today and invest with confidence.
Contact Alfinz Today for Personalized Investment Guidance Before You Start Investing
Need personalized financial guidance?
Contact Alfinz today for Investments, Insurance, Loans, Taxation & Financial Planning assistance.
Disclaimer: This article is published for general educational and informational purposes only. The content shared is based on common financial planning principles and personal finance awareness. It should not be considered professional financial, investment, tax, legal, or insurance advice. Financial decisions should always be made based on individual goals, risk profile, income, and personal circumstances. Readers are advised to consult a qualified financial advisor or professional before making any financial or investment decisions. Alfinz shall not be responsible for any financial loss or decisions taken based on this content.

Alfinz is a trusted financial advisory platform with 10+ years of experience in financial planning, wealth creation, retirement planning, mutual funds, stock market guidance, insurance, loans, and taxation services. We help individuals and families achieve financial freedom through personalized strategies, expert advice, transparent service, and long-term investment solutions.

Shiva Kumar is the Founder of ALFINZ, a financial planning and investment advisory platform dedicated to helping individuals make informed financial decisions. He holds NISM certifications in Equity Derivatives, Currency Derivatives, Equity Research Analysis, and Mutual Fund RTA. Through ALFINZ, he shares practical insights on financial planning, stock market investing, mutual funds, insurance, taxation, and wealth creation.